
Visual Studio has a fantastic feature in it that lets you quickly run the performance profiler against a unit test. Got a test that is running slow and you want to find out why? Go to Test Explorer, right-click that test and choose Profile. That'll automatically run that test with the profiler attached.
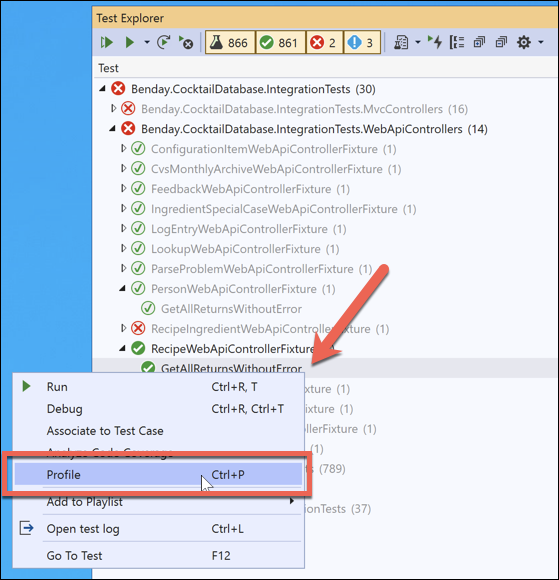
To run the performance profiler on a unit test, right-click the test and choose Profile
It usually works great but today when I went to profile a problematic test, I got an error message saying "File contains no data buffers."
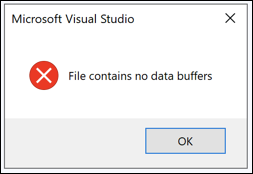
The error message telling me that the file contains no data buffers
I knew that I had run into this problem before with .NET Core projects but I couldn't remember what the solution was. I searched and searched and searched and eventually found this post that said "profiling .NET Core tests requires full PDBs" so "be sure to set Debug information level to Full on each project to be profiled." Ok. Cool. So next question, how do I set the Debug information level to full? More searching and more searching and I found this post that explains how to turn on full debug information in the PDB files.
Since I know that I'm going to run into this problem before and because I'm going to guess that other people will run into this problem, here's a blog post that walks you through how to fix that "file contains no data buffers" problem while profiling.
Solution Option 1: Advanced Settings in Debug Settings Editor
The setting you need to change is buried in the project property editor dialog. To get to the settings, first you'll need to open the project properties. In Solution Explorer, right-click on the project and choose Properties from the context menu.
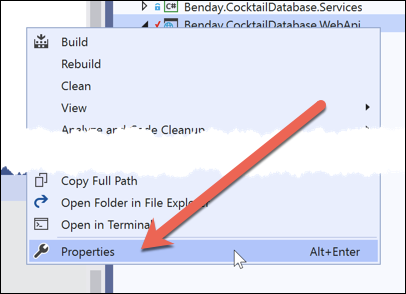
Open the project properties editor from the context menu
You should now see the project properties editor. In the left bar of the dialog, choose the Build tab and then click the Advanced button.
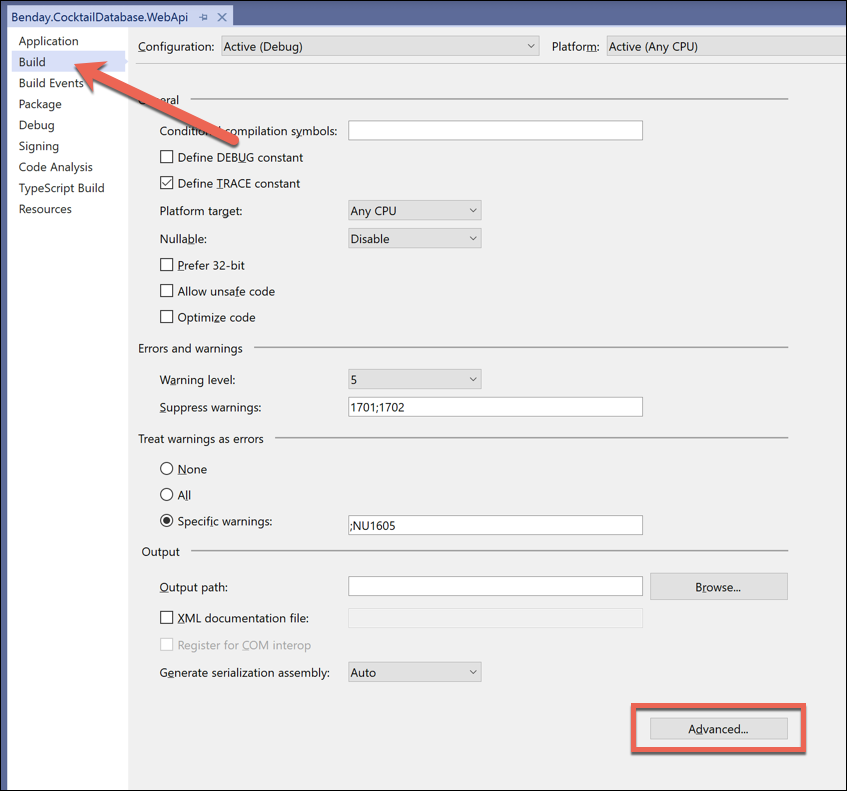
Click on the Build tab and then click the Advanced button
You should now see the Advanced Build Settings dialog. By default for .NET Core projects, the Debugging information field is set to Portable.
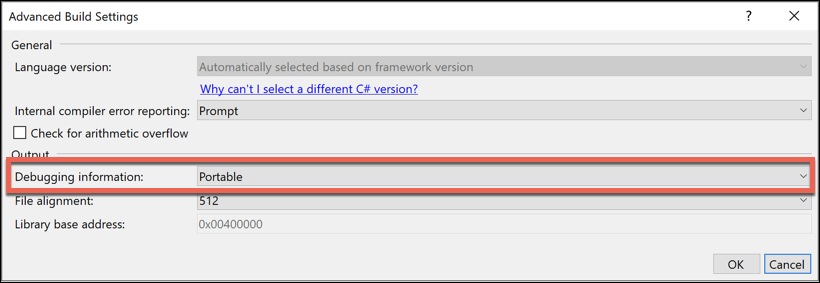
The default value is Portable for .NET Core projects
From the Debugging information drop-down, choose Full and then click the OK button.
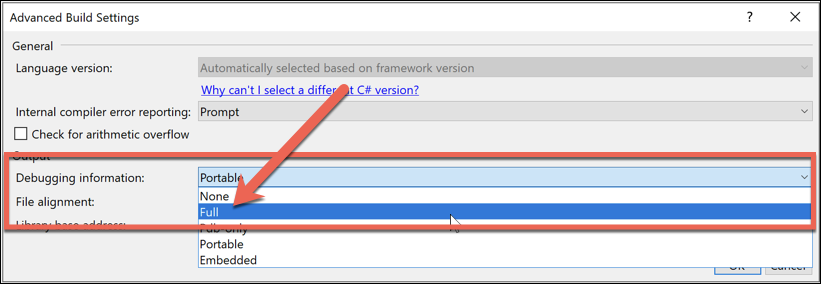
Change the Debugging information setting to Full
Save the changes to the project file. Now when you run the profiler for your tests, it should work.
Solution Option 2: Set Debugging to Full in the *.csproj File
The other option for setting the debug info settings for your project to Full is to simply edit the project file (*.csproj) directly in an editor. Once you have the csproj file opened, you simply have to add the following PropertyGroup as shown in the screenshot below.
<PropertyGroup Condition="'$(Configuration)|$(Platform)'=='Debug|AnyCPU'">
  <DebugType>full</DebugType>
  <DebugSymbols>true</DebugSymbols>
</PropertyGroup>
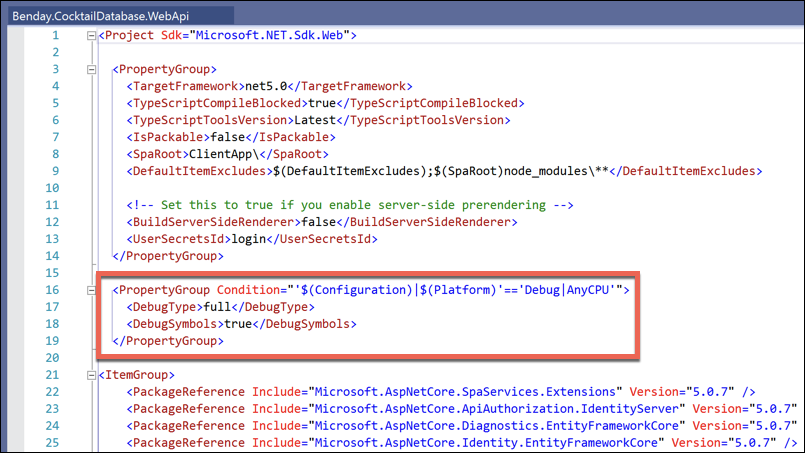
Add this property group to the csproj file to enable Full PDB generation
Save the changes to your csproj file and then when you Profile your test, it should work.
Summary
In short, setting DebugType to Full is easy but it's buried deep in dialogs within Visual Studio. It's a quick fix for the 'File contains no data buffers' error message.
I hope this helped.
-Ben
-- Running into performance problems with your .NET Core applications? Slow Web APIs? Dawdling ASP.NET MVC Controllers? Entity Framework performance got you down? We can help. Drop us a line at info@benday.com.