I was trying to debug an issue that I was having on one of my Azure App Services. Visual Studio 2022 Remote Debugging was exactly what I needed but I kept getting a strange authentication error. Turns out that it was related to the App Service settings for basic auth. Here’s how I fixed it.
FYI, if you don’t feel like reading, you can watch the video version of this blog post on YouTube: (How to Fix Azure App Service Remote Debugging in Visual Studio 2022](https://youtu.be/da0gewliIHo)
The Problem
So I was running into a problem with an app I’m hosting on Azure App Services and needed to do some remote debugging against the app. The basic gist of the problem in the application was that I was getting unexpected behavior in my security code – basically, users were being denied access and I wasn’t sure why.
But I did know where in the code I wanted to start looking so I added a breakpoint and tried to start a remote debuggging session from Visual Studio 2022 to the App Service running in Azure.
How Do You Create a Remote Debugging Session from Visual Studio to an Azure App Service?
This remote debugging feature is one of the coolest things and it’s a total life-saver. (And when I think of the complexity that must have gone in to implementing this in Azure, I’m just in complete awe.)
To do this, go up to the Debug menu in Visual Studio and go to the “Attach to Process” menu item.
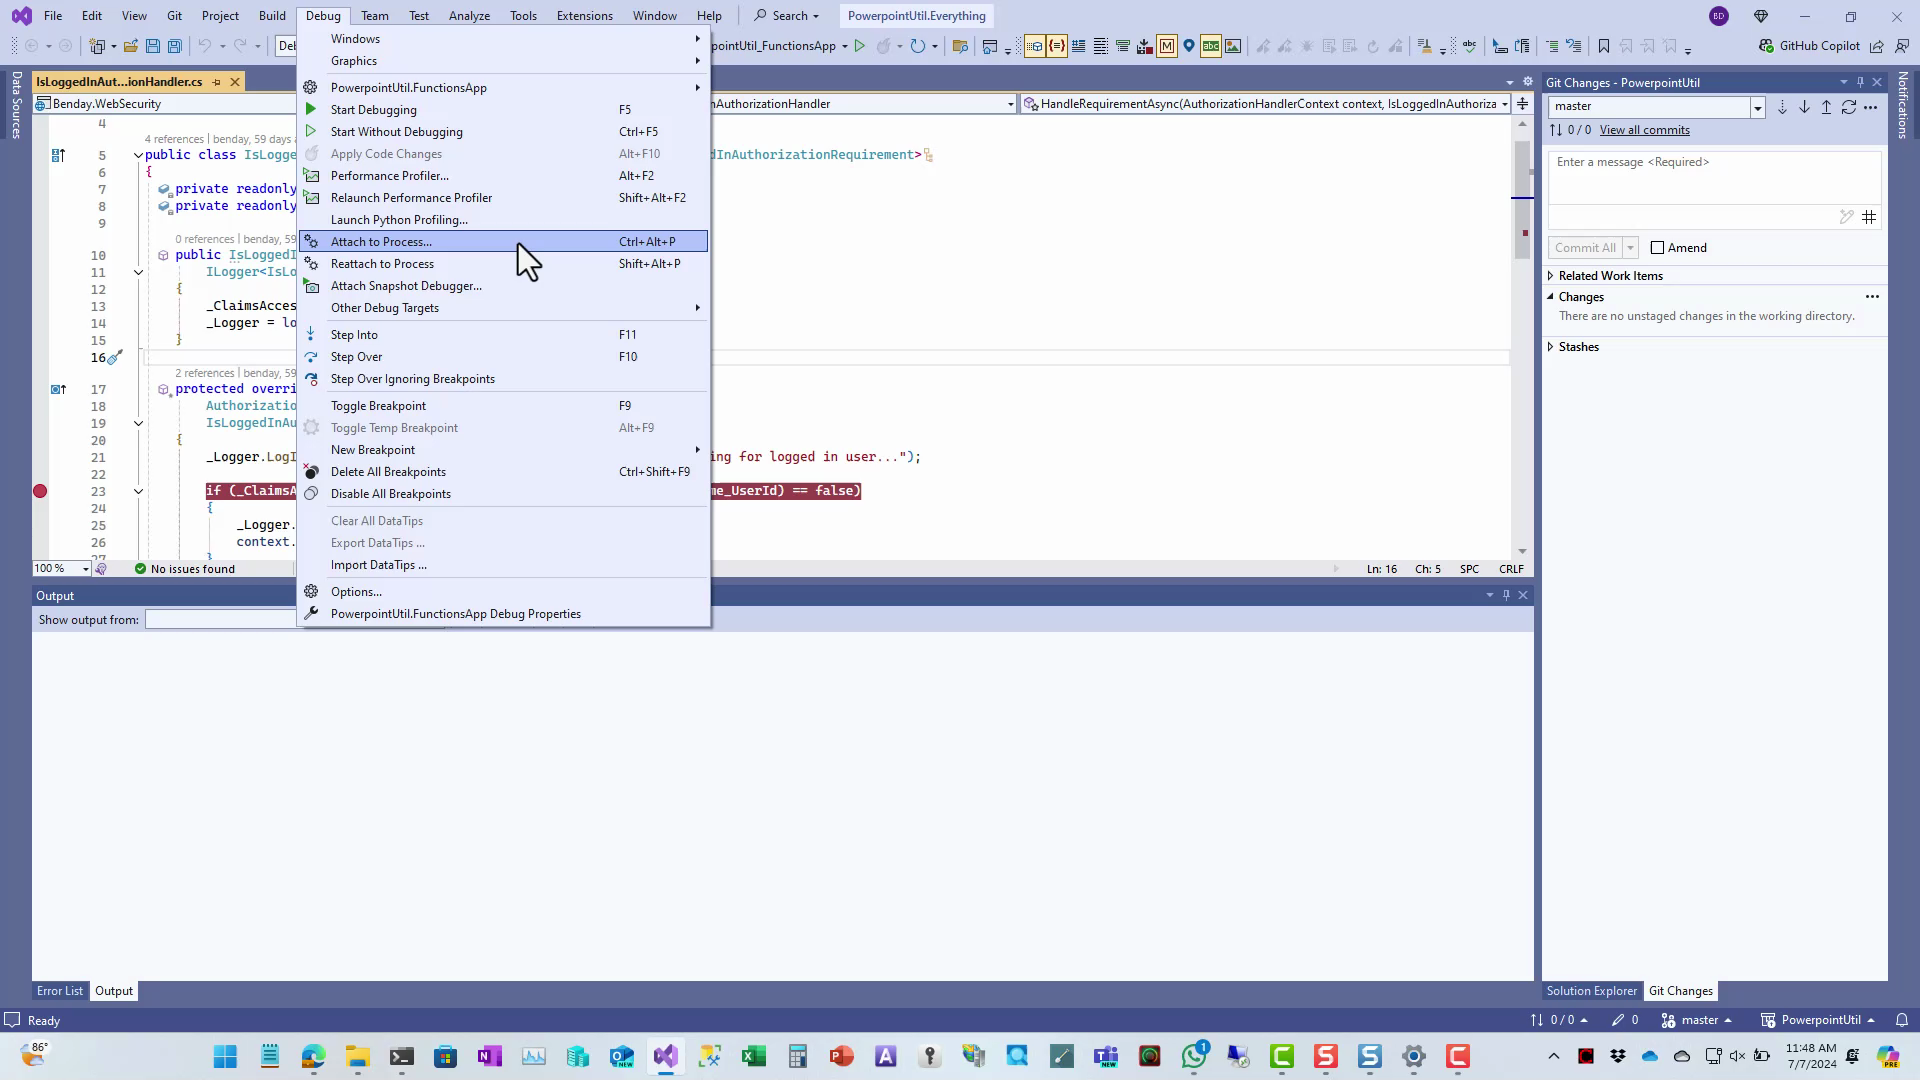 Start a Remote Debugging Session from the Debug -> Attach to Process… menu item
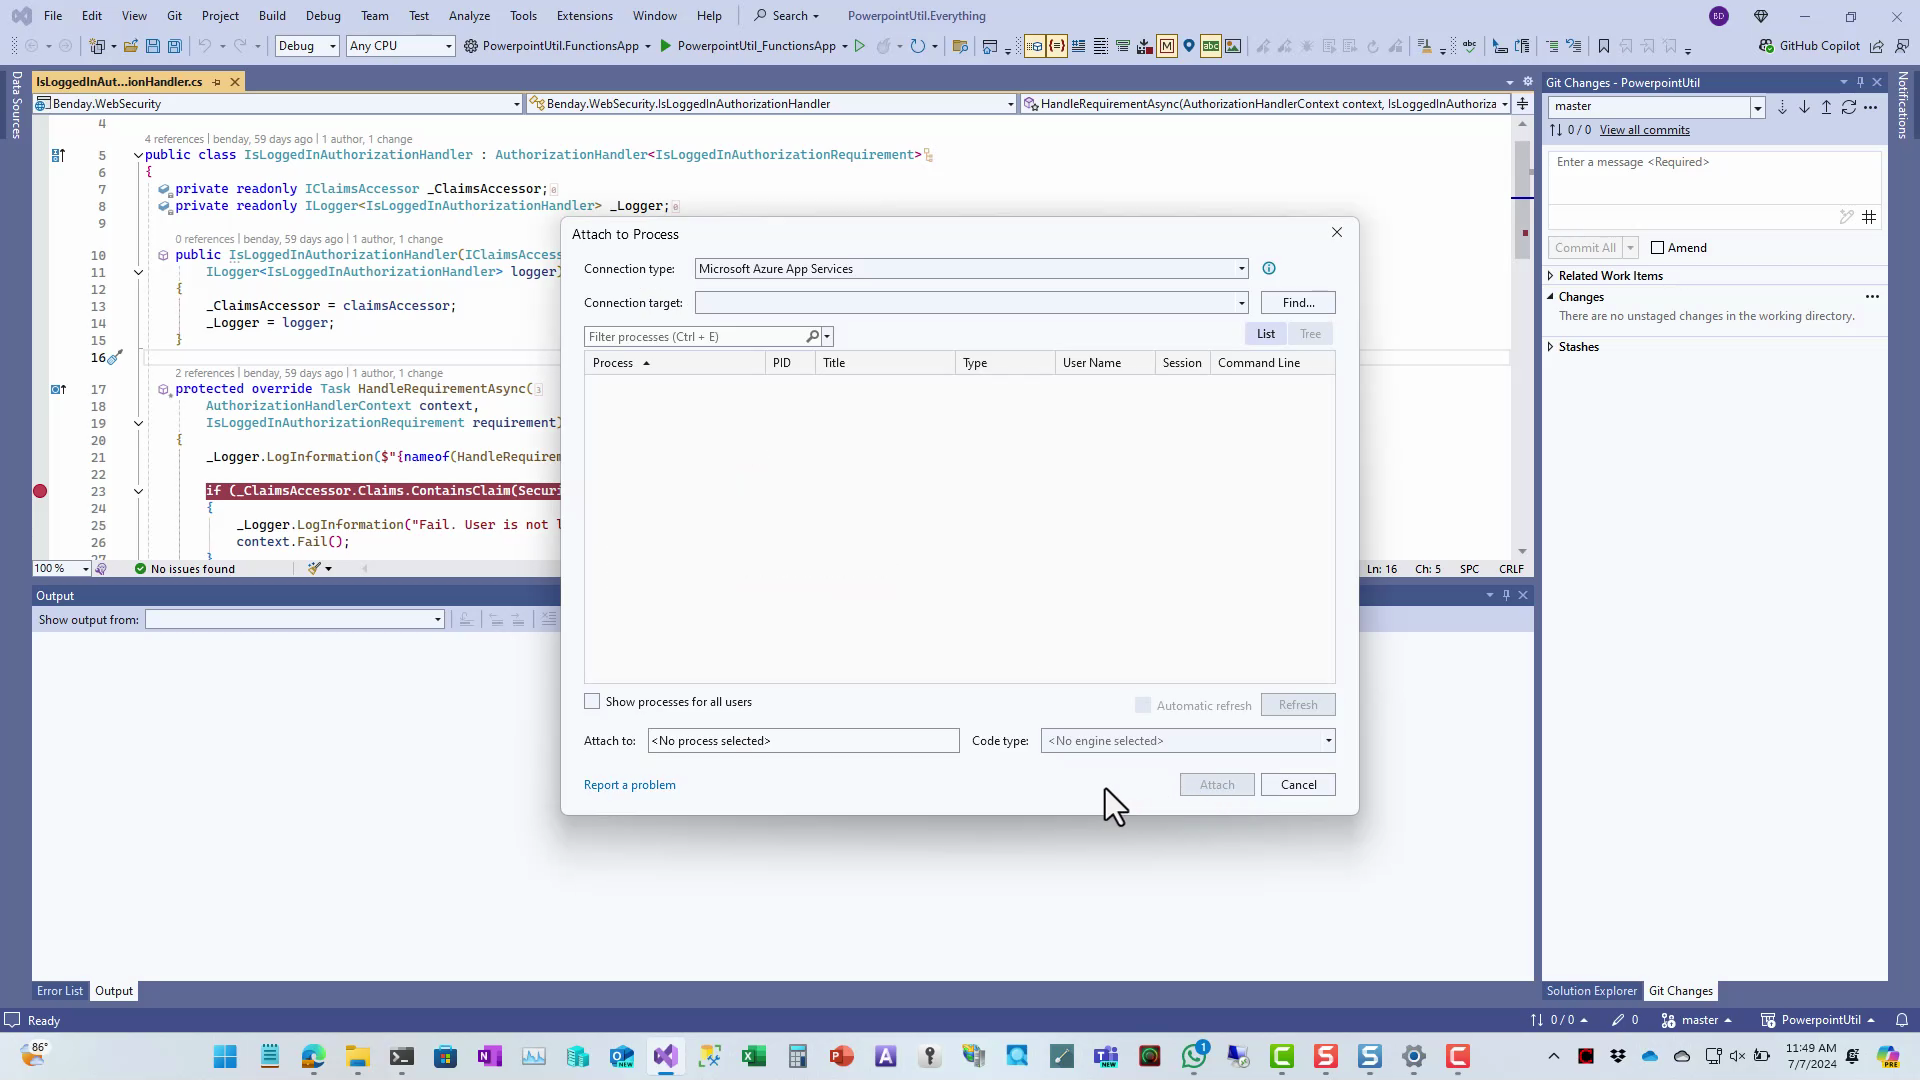
You should now see the Attach to Process dialog. Since we’re going to be trying to debug something in an App Service, make sure that you’ve got “Microsoft Azure App Services” selected in the Connection Type dropdown list. Then you’ll click the Find button to begin the process of choosing what you want to debug.
 Choose ‘Microsoft Azure App Service’ from the Connection Type list then click Find…
You should now see the Azure Attach to Process dialog. You might need to authenticate before you see the list of resources but eventually, you should see the list of resources in the bottom half of the dialog.
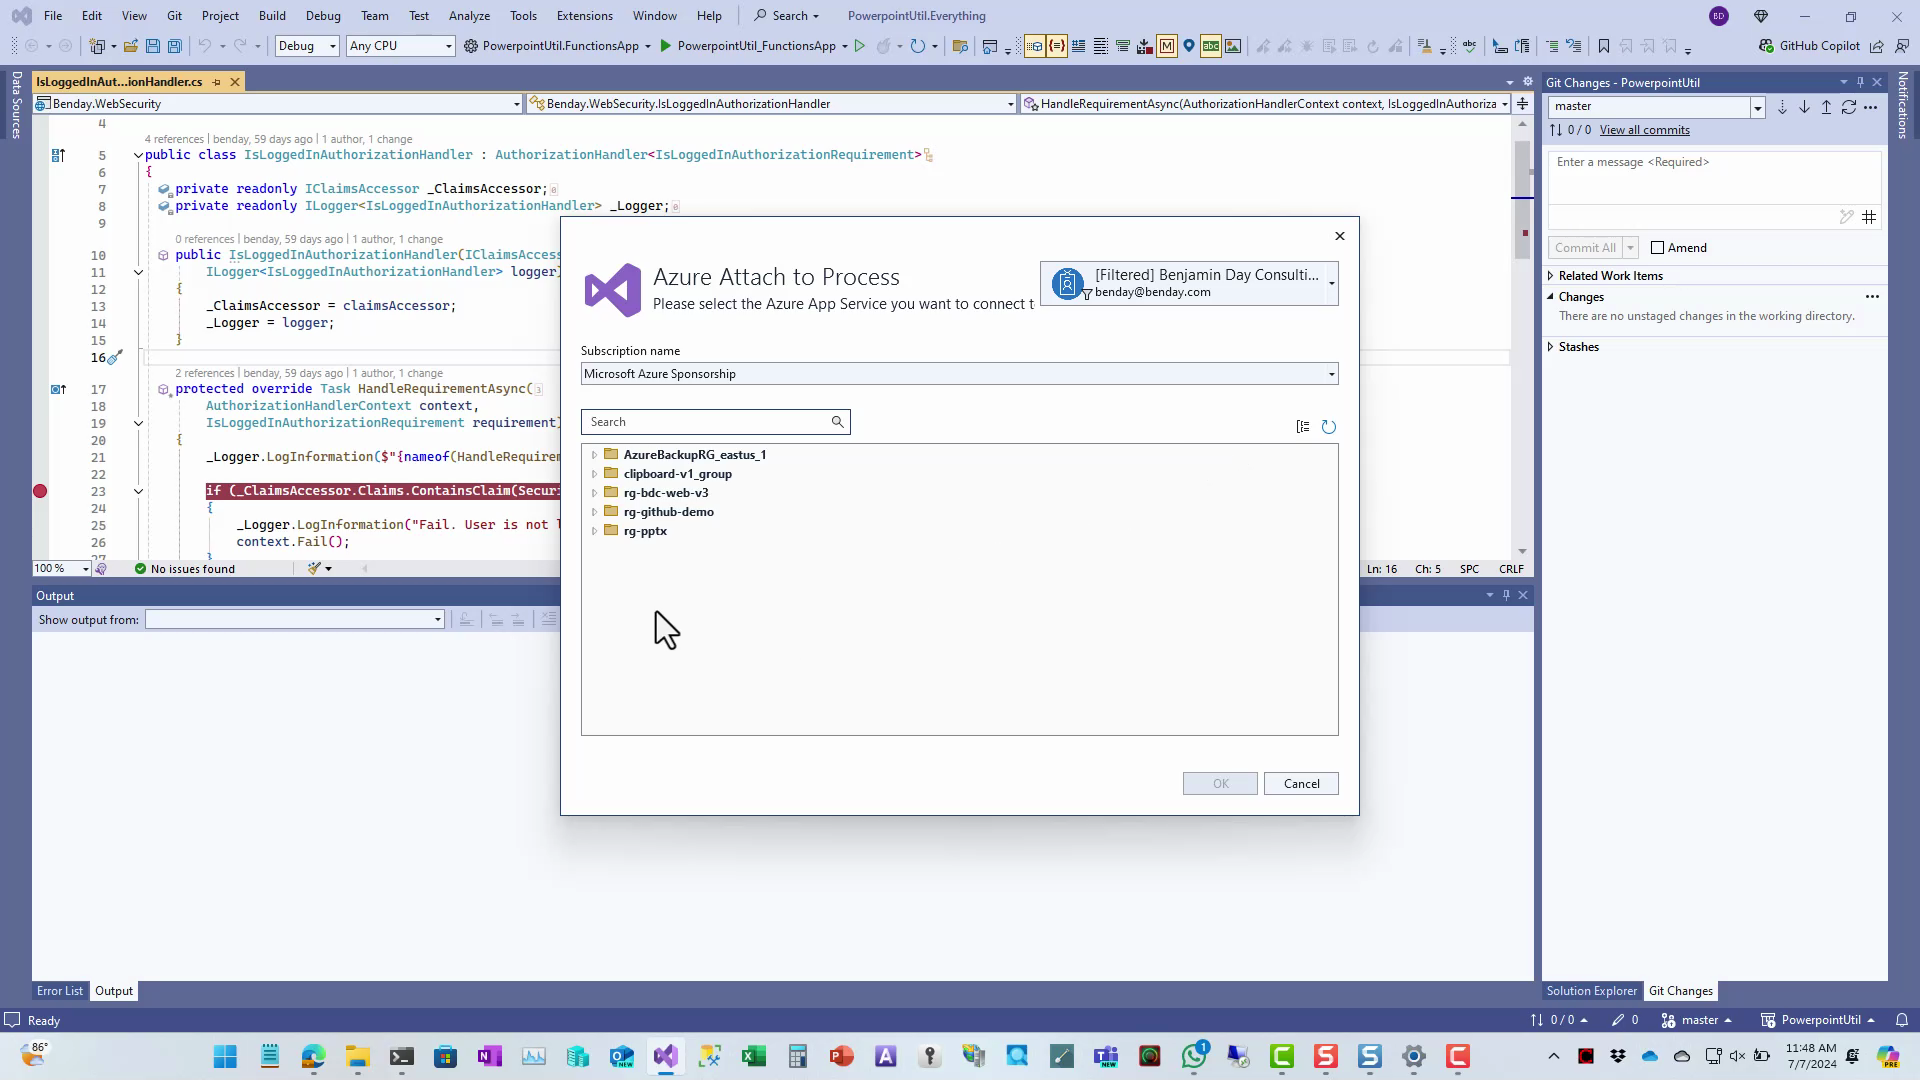 The Azure Attach to Process dialog shows you the list of what you can connect to
In the list of resources, find and select the App Service that you want to debug. BTW, you’ll probably need to open up the resource group folders to find what you need.
 Select the App Service to debug
After you’ve made the selection, click the OK button.
You should now be back at the Attach to Process dialog and the Attach button should no longer be greyed out. Click Attach to attach to that app service instance using the debugger.
The Error: It wants a Username & Password
You should be off and running with your remote debugging session at this point. But instead, I was getting a request to authenticate. Which seemed totally weird to me because I was already authenticated. Plus, to make it even more confusing, I kept trying to auth using my known good username and password and it kept failing.
I not only tried using my username & password but since I was doing this from a Windows 11 machine with Windows Hello, I tried using Windows Hello to log in. Nothing worked.
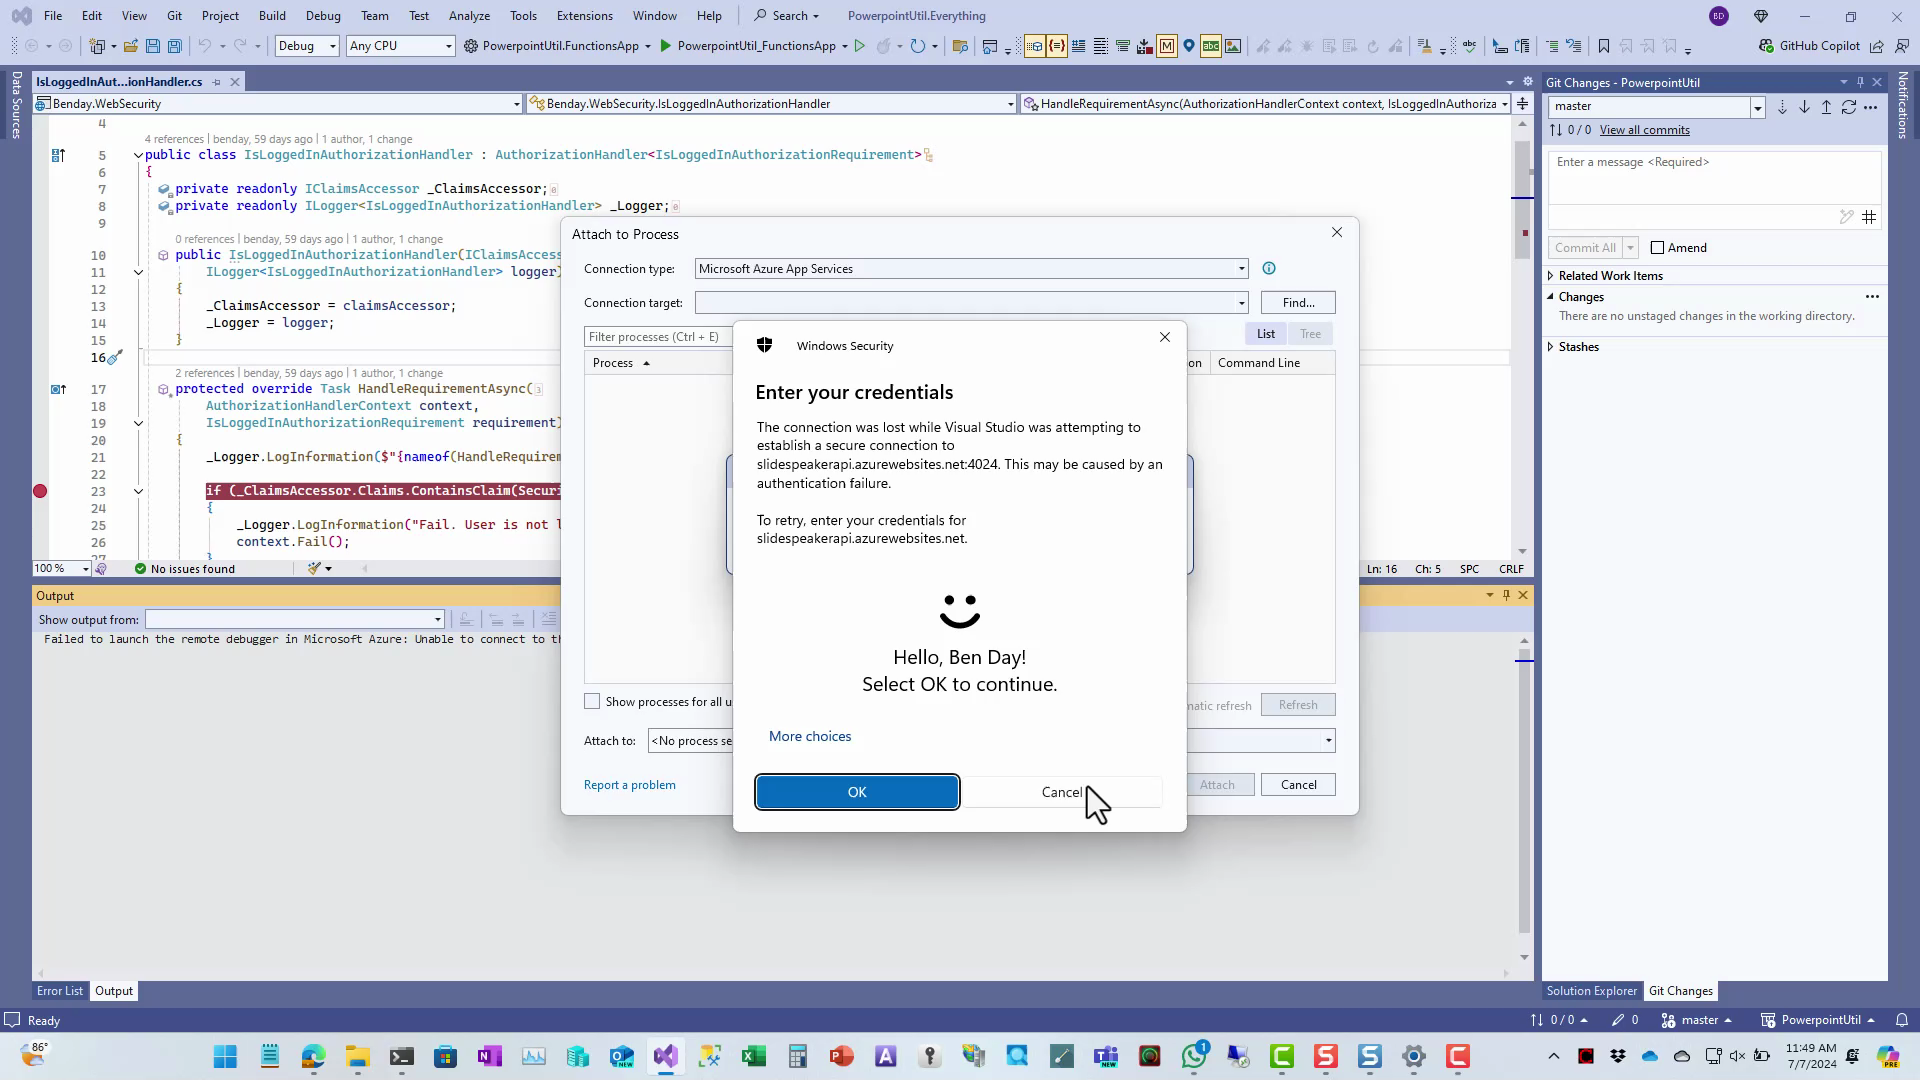 Attach to Process keeps asking me to enter my credentials
After trying a bunch of different options, it would eventually serve up a completely unhelpful error message. It’s an error that doesn’t say much other than “well, that didn’t work”. Unable to connect. Unspecified error. (Sigh)
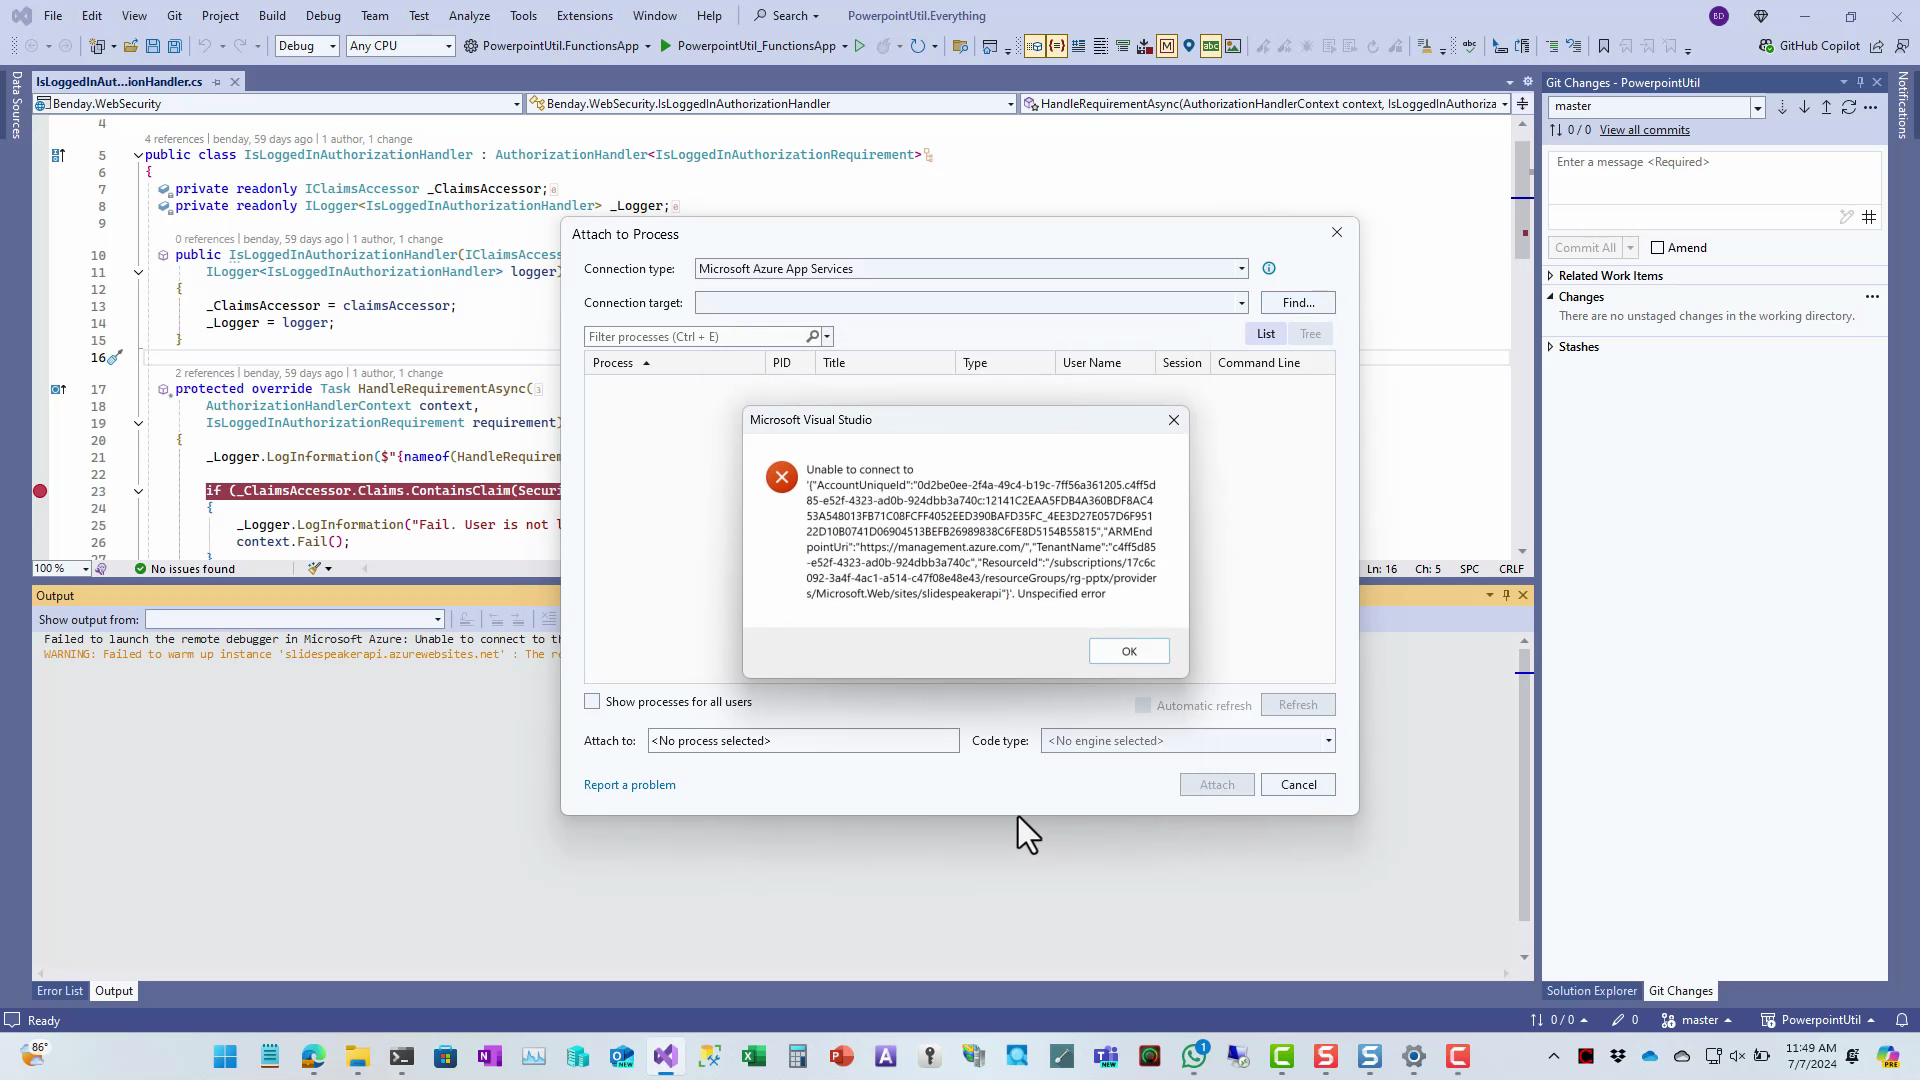 Unable to Connect. Unspecified Error.
Getting Towards a Solution: Attempt to Download The ‘Publish Profile’
Someone in a thread somewhere on the internet (disclaimer: I don’t remember where…sorry) suggested that the username and password that this dialog wants is part of the Publish Profile for the app service. That wasn’t the actual solution but trying to access the Publish Profile started me down the path towards an answer.
To download the publish profile for the App Service, go to the Azure portal - portal.azure.com - and go to the Overview page for your App Service.
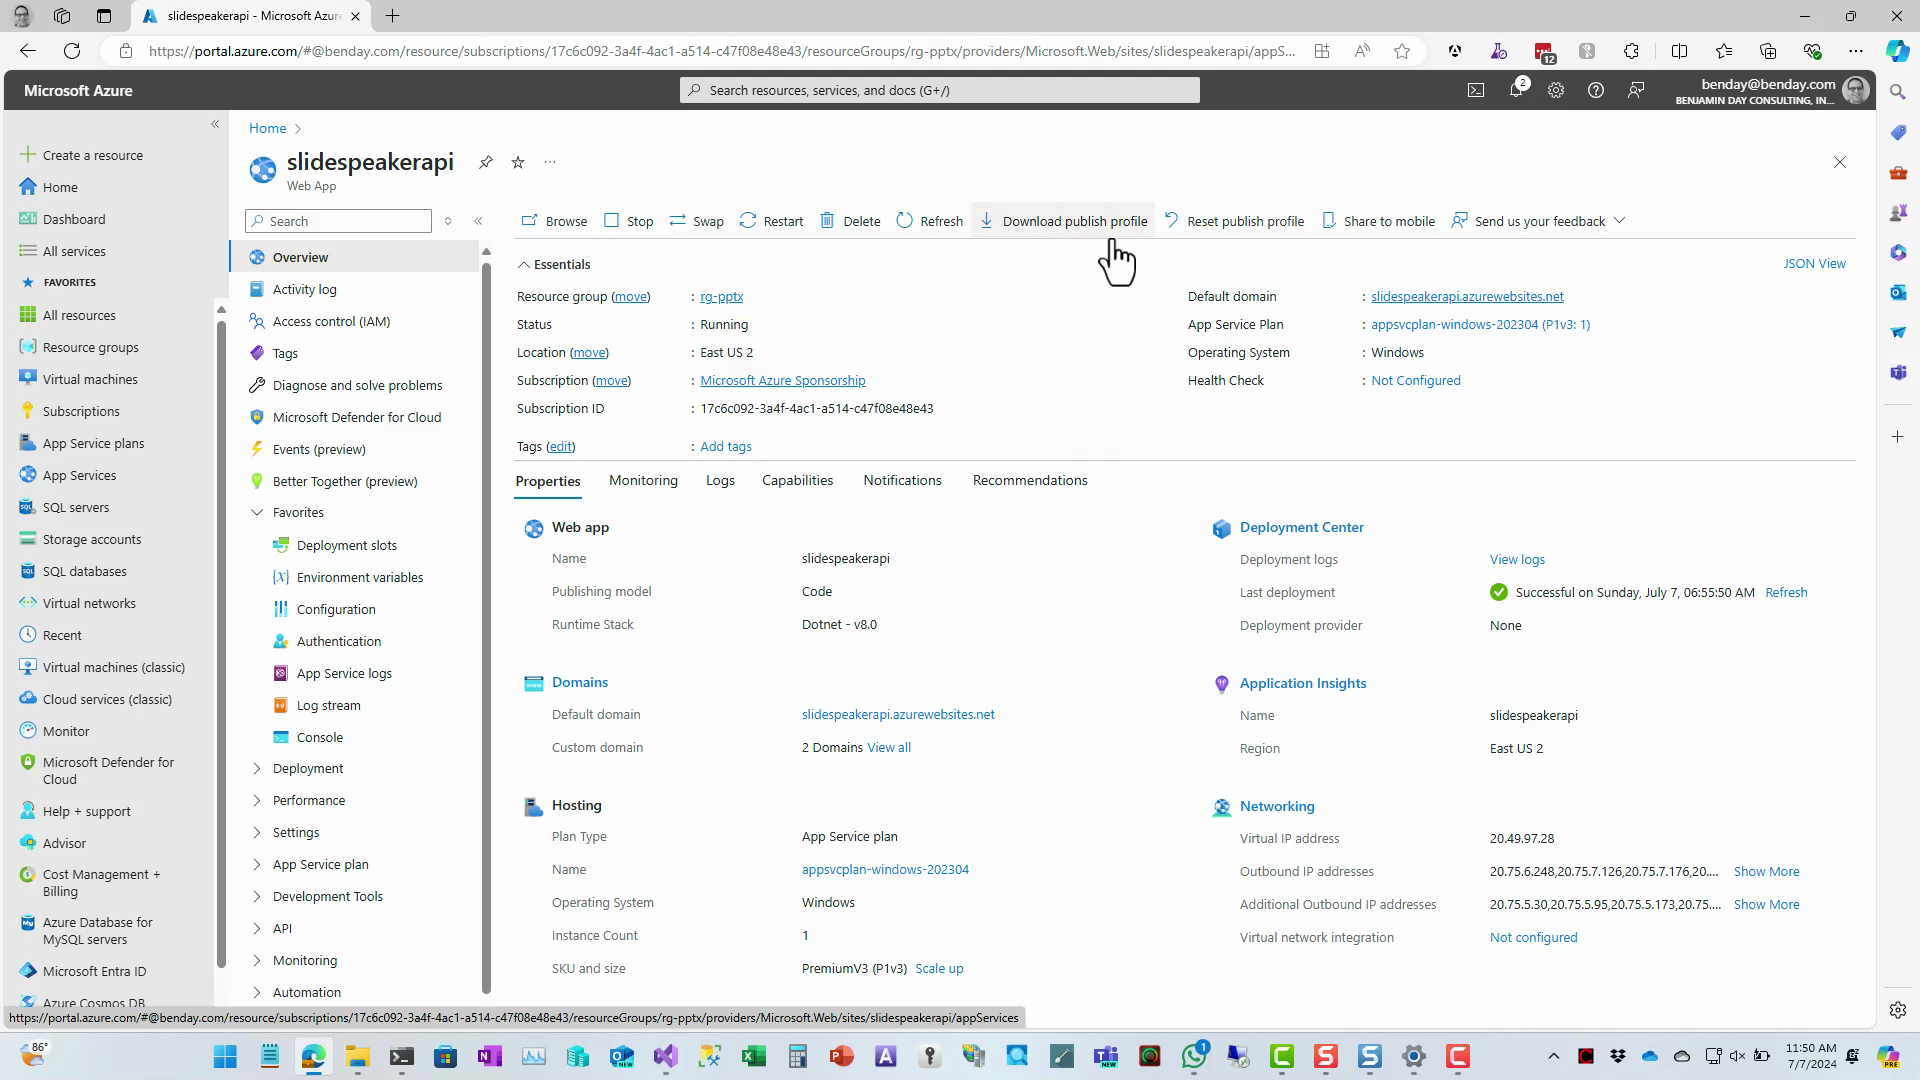 The Download Publish Profile button on the Azure Portal
When I click the download button, it attempts to download the publish profile info but it fails.
The error says “download publish profile” “basic authentication is disabled”.
I don’t remember turning basic auth off but let’s go check.
Enable Basic Auth on the App Service
To enable Basic Auth for the app service, you’ll go to the Configuration tab for your App Service.
There’s the setting. And Basic Auth is indeed turned off.
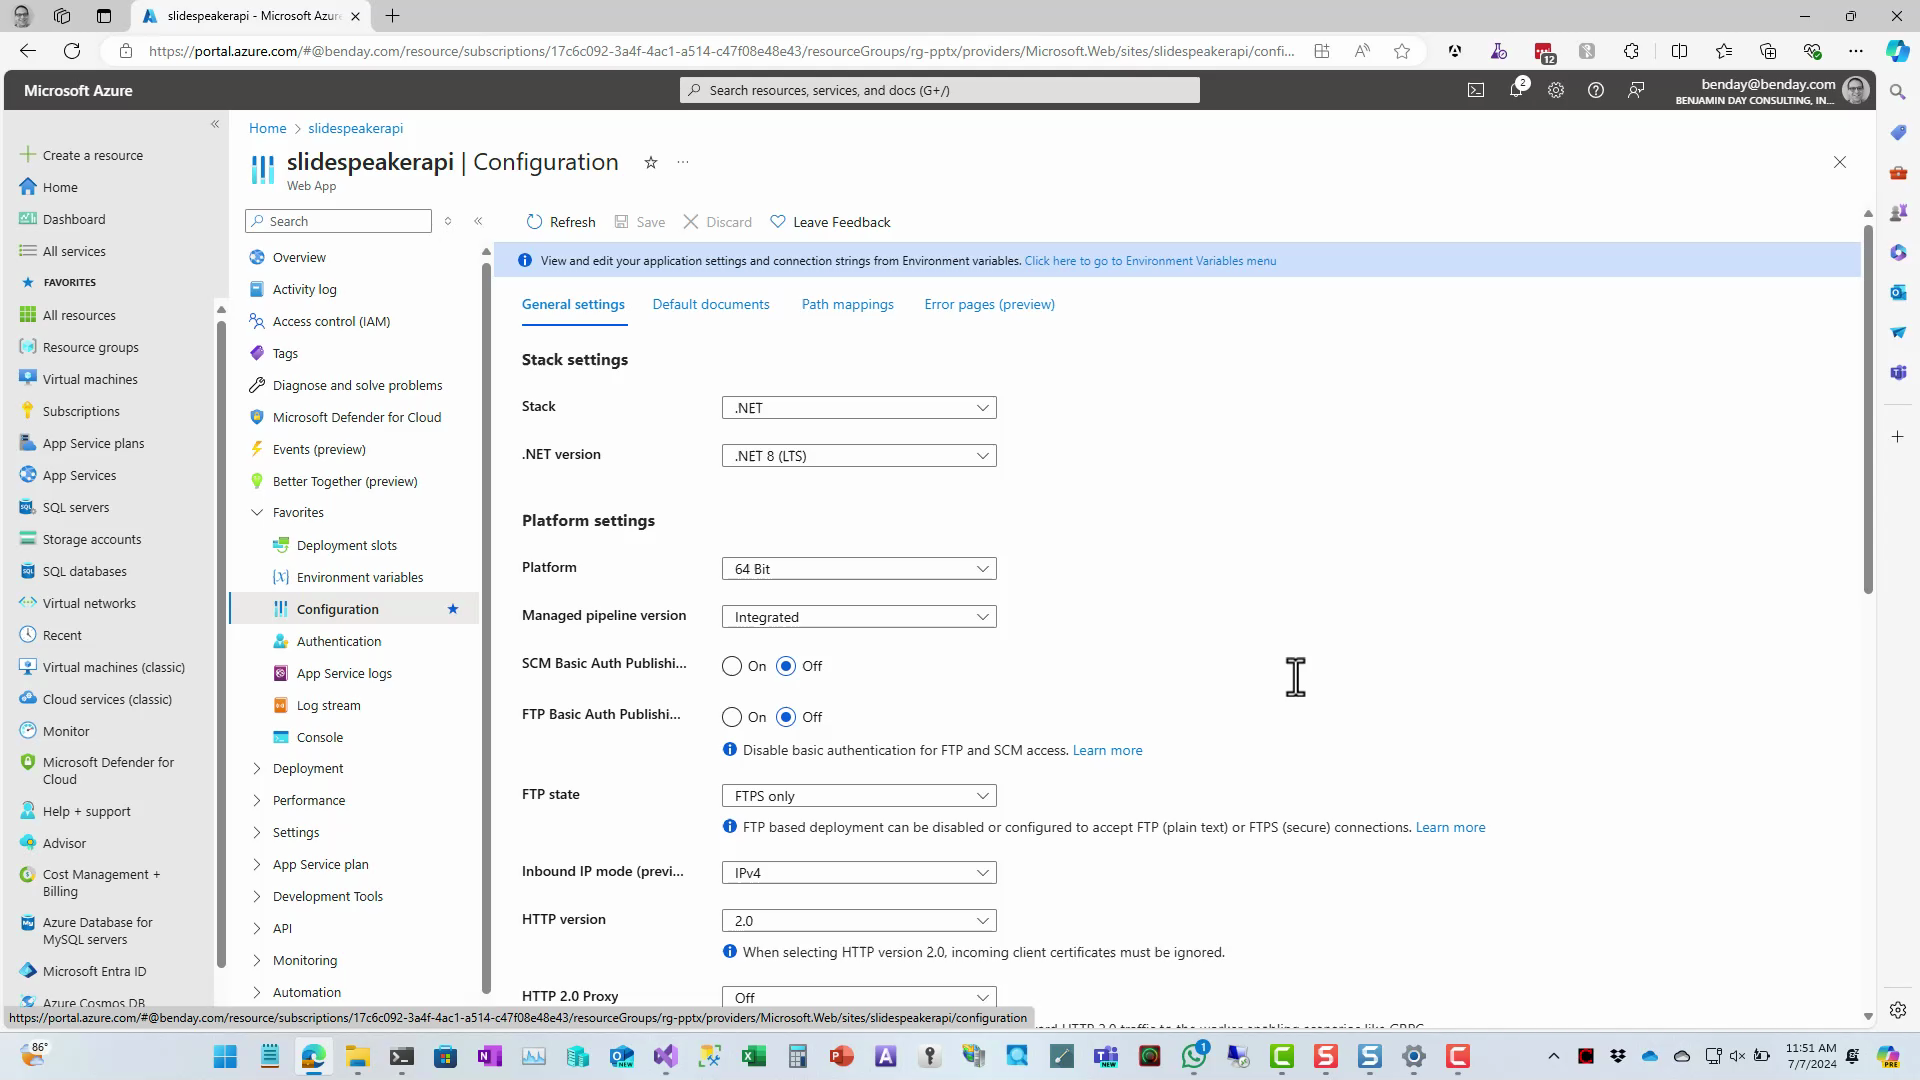 The Configuration tab for the App Service and the Basic Auth setting
Change the value to On, click save and then click continue on the confirmation page.
This saves the configuration change to the App Service and the app service will restart.
Retry Remote Debugging Attach to Process
Go back to Visual Studio and re-try the remote debugging connection. Go to Debug -> Attach to Process… and go through the steps described above.
This time the process will run without prompting you for additional credentials. It should also show you the list of processes that you can bind to. The one you want to choose is w3wp.exe.
Choose that process and then click the Attach button.
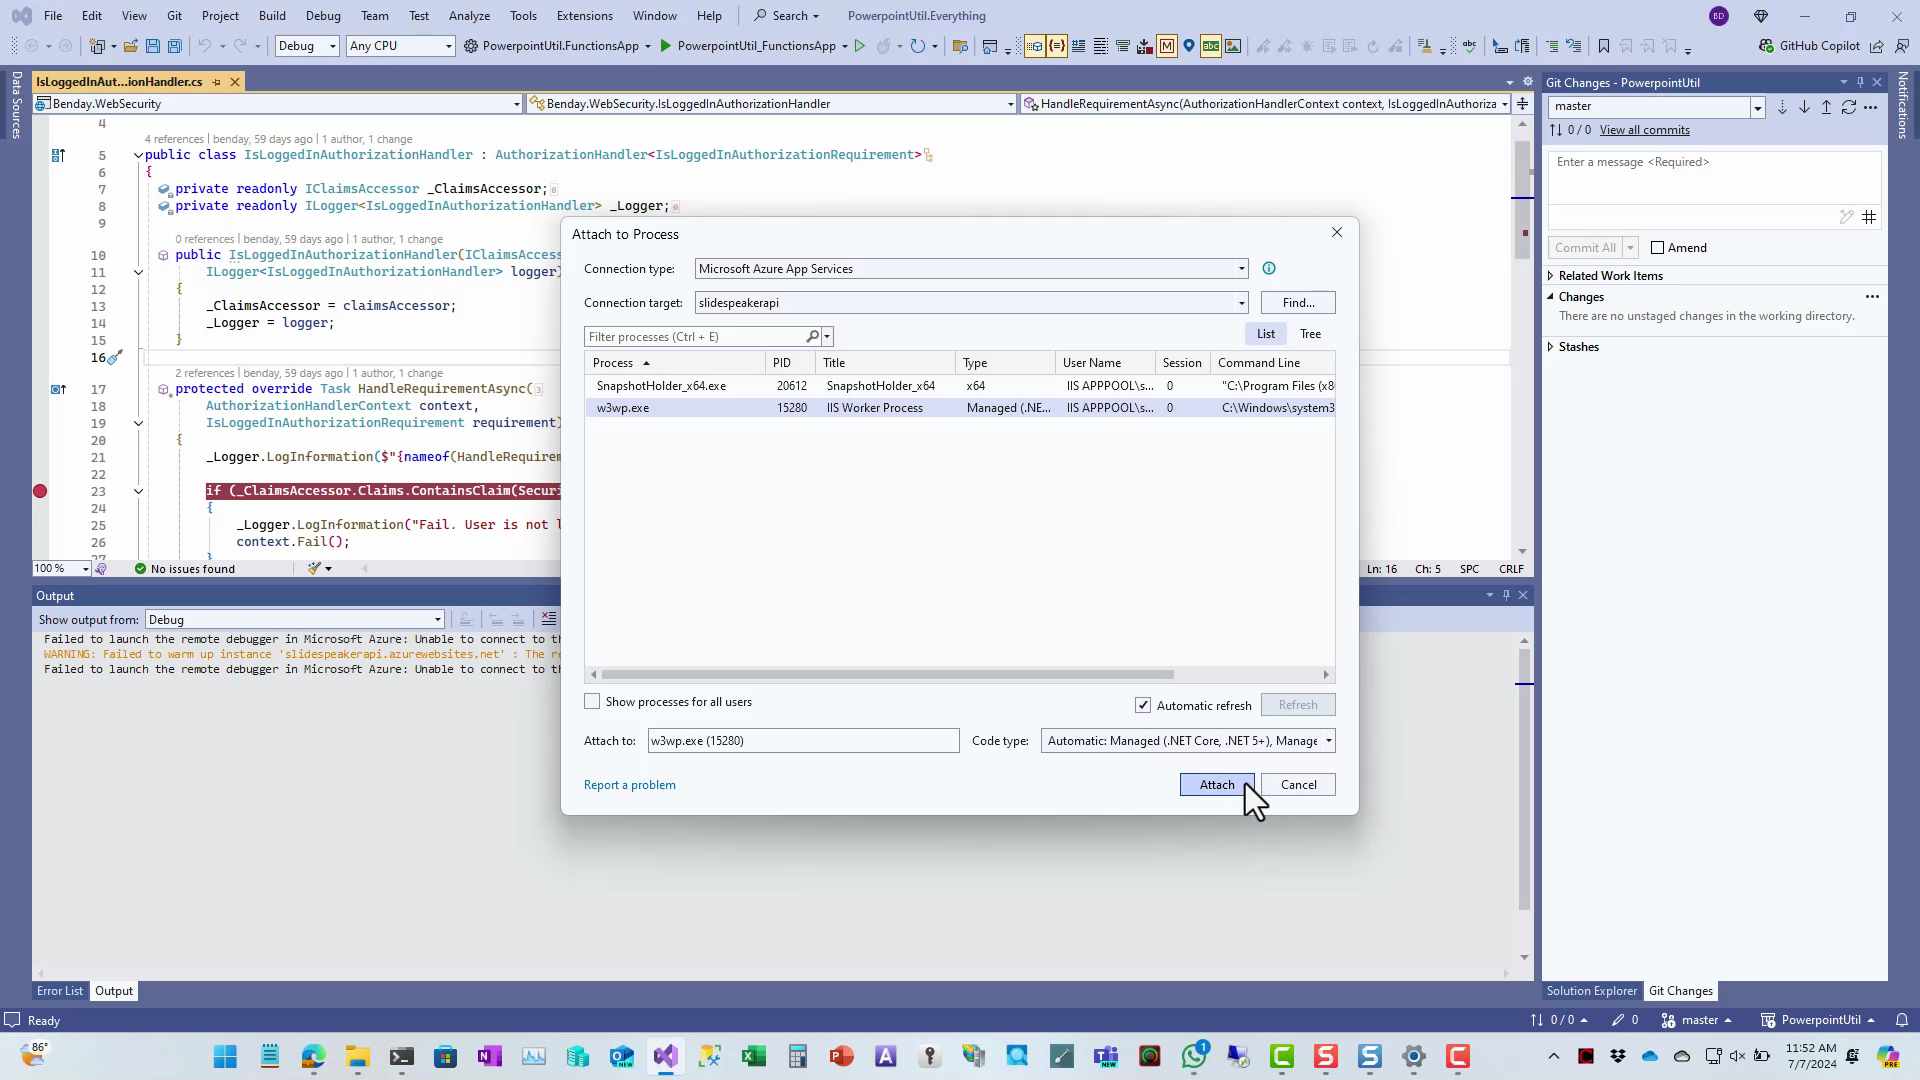 Attach to the w3wp.exe process
At this point, when you trigger your application logic in your App Service, you should be hitting breakpoints in Visual Studio.
Problem solved.
Summary
Ultimately, it turned out that Visual Studio 2022 simply couldn’t authenticate with the Azure App Service for remote debugging. The reason was that basic auth was turned off in settings for the App Service. Once I enabled basic auth, I was able to download my publish profile and more importantly, to use Remote Debugging from VS2022 to Azure.
You probably won’t want to leave Basic Auth turned on for production applications but if you need to debug a problem, now you know how to do it.
BTW, if you’re interested in a video version of this, I’ve posted it to YouTube: (How to Fix Azure App Service Remote Debugging in Visual Studio 2022](https://youtu.be/da0gewliIHo)
I hope this helped.
-Ben


