Yes, you can predict the future. Well, maybe more like forecast the future. And Azure DevOps can help by using Flow Metrics. Specifically, something called throughput.
Think about the three big questions that you get asked in software scheduling:
How long is it going to take to ship this pile of requirements?
How much stuff can we get done in X weeks?
When is this item going to ship?
It's actually kind of a simple idea. Use the data from how your team has performed so far to forecast what they'll likely be able to do in the future. The specific data you want to use is called "throughput". Throughput is how many items of work the team was able to move to Done in a certain period of time. That period of time can be whatever you want it to be -- a day, a month, a sprint -- but the easiest one for people to understand is a week. 7 days.
The thing that's mind-blowing is that you don't worry about how long it took to get an item done -- you only look at how many items made it to done. You *could* look at how long it took to get to done (aka. Cycle Time) but it's not all that helpful for prediction. The team's Cycle Time value is more interesting for that team to measure itself and look for opportunities to improve.
Azure DevOps & Throughput
Enter Azure DevOps. If you've been working with Azure DevOps and using it to track your work, it's been capturing everything you'll need to compute your team's throughput. Every time that you marked a Product Backlog Item or User Story work item as 'Done' in Azure DevOps, it was recorded. We're going to use that data to predict the future.
Getting this data out of Azure DevOps takes a little work. But before you panic, I've written a free Azure DevOps utility called 'azdoutil' that will help you with this. https://github.com/benday-inc/azdoutil/ AzdoUtil has three commands that you'll find helpful:
forecast duration for item count
forecast items in weeks
forecast work item
All three of these forecasts -- predictions -- start by getting the number of Product Backlog Items that made it to Done in a certain number of weeks and then grouping those by week. Here's an example of how that might look:
| Week # | Number of PBIs Done |
| 1 | 5 |
| 2 | 8 |
| 3 | 3 |
| 4 | 7 |
| 5 | 6 |
Hypothetical 5 weeks of throughput data
It doesn't look like much but that's just about everything you need to know in order to start predicting the future.
Estimation, Probability & Monte Carlo Simulations
One thing I haven't mentioned so far is estimating your work. How big are these PBIs that the team is getting done? How long does it take them to get any particular requirement to done? What's the team's estimate?
The reason I haven't mentioned any of these estimation-y things is because -- well -- it doesn't matter. You're going to assume that the team's work in the past is probably something like what it'll be in the future. Probably.
The word "probably" is doing a lot of work here. It's connecting the real, solid, actual data of what your team has historically managed to deliver -- their throughput -- and turning that into predictions of the future. Let me correct myself -- "forecasts for the future".
There's always uncertainty in the future. There was uncertainty when you were working before. You just happen to know what the outcome was -- because you're already in the future. Software development and delivery is an uncertain business. Some features are bigger or smaller than others. Things go wrong. Things take longer than you expect. Requirements don't show up on time. There's no shortage of ways that software development can hit snags -- but that's all already baked into your historical data. What you did in the past is probably similar to what you're going to do in the future. Probably.
So when you create forecasts of the future using historical data, you're going to be using statistics and probability. And you'll need to find a way to generate some statistical fuzziness to help create meaningful predictions. There's a technique for creating this statistical fuzziness called a Monte Carlo simulation. You're basically going to pick a bunch of random numbers and use that to create that statistical fuzziness. But you're going to create A LOT of these random number draws to simulate a lot of possible outcomes.
Once you have all those simulated outcomes, you'll look at which outcomes were most likely. More on that later.
Using Throughput & Monte Carlo to Predict the Future
You can do all of these calculations without using any special tools but if you have access to something like Azure DevOps you can capture and process that data much more efficiently. That weekly throughput data from Azure DevOps is the basis of our Monte Carlo simulation.
In the table of weekly throughput that I created, there are 5 weeks. (Note: there's nothing magical about 5 weeks…that's just what I picked.) To start simulating the future, we're going to pick a number at random between 1 and 5. If the random value is 1, we'll use the throughput number for week 1. If the random value is 2, we'll use the throughput number for week 2. etc etc etc.
| Week # | Weekly Throughput / Number of PBIs Done |
| 1 | 5 |
| 2 | 8 |
| 3 | 3 |
| 4 | 7 |
| 5 | 6 |
Hypothetical 5 weeks of throughput data
Let's say we want to predict what we can do in the next 5 weeks. We're going to do that random number exercise to create a "simulation" of the next 5 weeks might be like. Pick 5 random numbers (roll the dice) and use those to pick random weekly throughput info for each week. That'll give you something like you see below in Simulation #1.
Simulation #1:
| Simulated Week # | Simulated Weekly Throughput / Number of PBIs Done |
| 6 | 7 |
| 7 | 5 |
| 8 | 3 |
| 9 | 8 |
| 10 | 5 |
| Total Throughput | 28 |
Simulation #1 showing a possible outcome for the next 5 weeks
In Simulation #1, you get a total forecasted throughput of 28.
7+5+3+8+5=28
At this point, you're probably looking at this and thinking "well, that's not very interesting…that's just one randomly generated 5 week period. Who cares?" You're correct. Nobody cares about just one simulated 5 week period. So we're going to do that a thousand times. We're going to create 1000 simulations. 1000 randomly generated outcomes for how the next 5 weeks might go.
One randomly generated outcome isn't very helpful. Real useful data starts to come when you have a lot of those randomly generated outcomes.
Extracting Signal from Noise: How Often Do Outcomes Happen?
Remember that we're trying to forecast the future. Forecast. Prediction. Whatever you call it. It's uncertain and it's not guarantee. But what's our level of confidence in our prediction? Are we 50% sure? Are we 80% sure? Are we 100% sure?
You've probably been asked this question by your bosses and stakeholders before -- "what's your level of confidence in your estimate?" You probably said something like "pretty good" or "reasonably confident" -- something totally meaningless and unsubstantiated by data. Using these simulations, you'll actually have a way of quantifying your level of confidence.
Let's take that "what can we get done in the next 5 weeks" question. You've run your 1000 simulations of how the next 5 week could go. You have 1000 possible outcomes for that 5 week period. If you graph those 1000 possible outcomes, there will naturally be a bell-curve shape to the data.
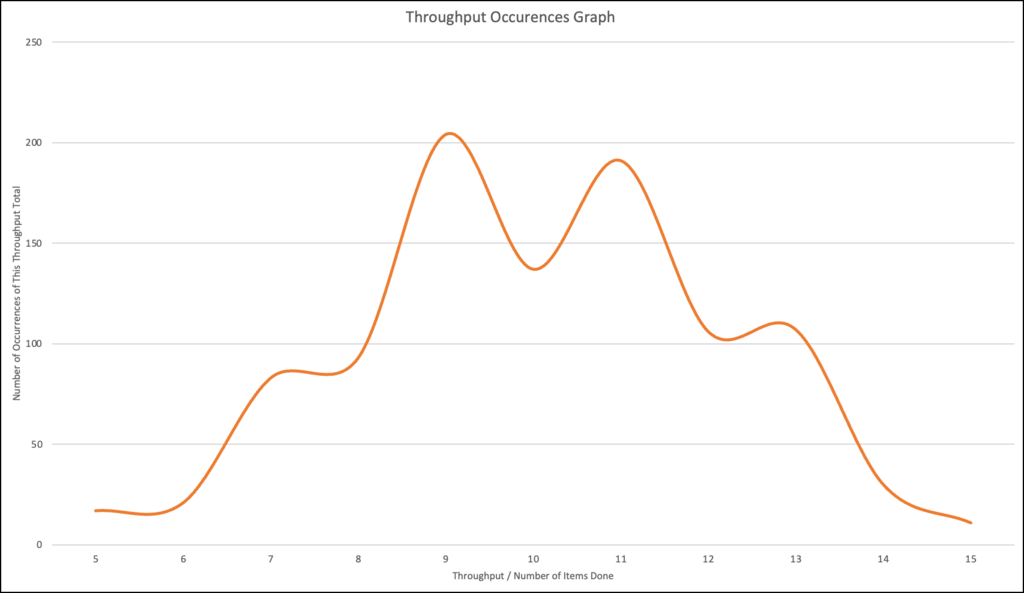
A Graph of 1000 Simulated 5-week Throughput Outcomes
NOTE: I'm going to use some data I generated using data from Azure DevOps.
What's you're doing when you graph this data is looking at how often you see certain outcomes. Along the bottom (the X-axis) of the graph, is the list of throughput values that emerged from the Monte Carlo simulations. The Y-axis shows how often that throughput total came up. Put another way, this graph shows us how often is the total throughput for that time period occurs.
The table below is the same data in spreadsheet form. Looking at the raw data below, the most common total throughput outcome is 9. Out of our 1000 simulations, we had a total outcome of 9 items of throughput 204 times.
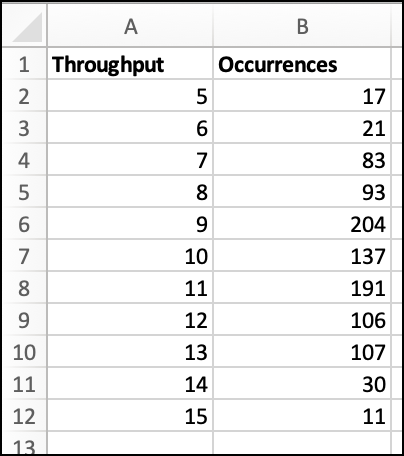
Some throughput data from Azure DevOps
Confidence in Outcomes
For the question of how much can we get done in 5 weeks, you want to know what your level of confidence is for each of these outcomes. For example, the team might have a miraculous 5 weeks and get 15 items done. But as you can see from the data below, there's only a 1.1% chance of that happening. Out of 1000 simulations, that 15 item throughput only happened 11 times. It could happen…but it's not very likely to happen.
To get the confidence % numbers, you calculate up from the bottom -- highest throughput to lowest throughput. To get your 50% confidence level, add up the number of occurrences until it totals to 500 (half of the simulations). To get your 80% confidence level, add up the number of occurrences until it totals to 800 (80% of the occurrences).
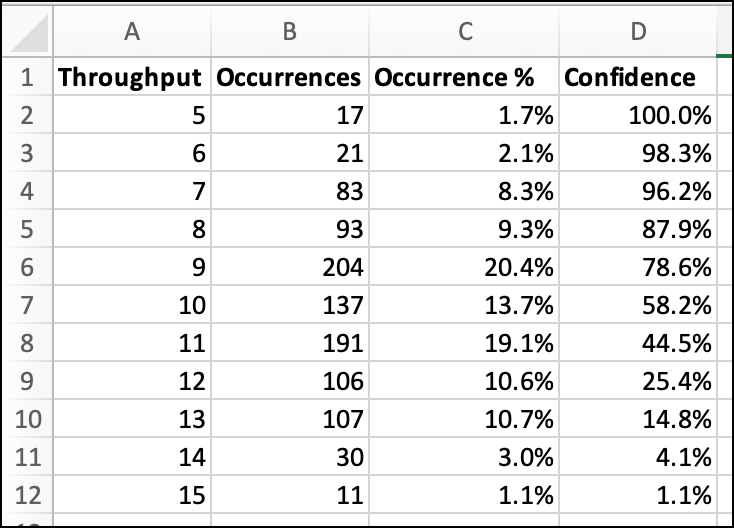
Some throughput outcomes from Azure DevOps with level of confidence
If you want to see exactly how I calculated this, here's an Excel spreadsheet with the raw data.
Forecasting with AzdoUtil: Forecast Items in Weeks
You can calculate all this by hand or you can use my utility. The data above came from my Azure DevOps account by running the following command:
azdoutil forecastitemsinweeks
 /teamproject:"Metrics and Dashboards Research"
 /numberofdays:120 /forecastweeks:5
That command will use data in the "Metrics and Dashboards Research" team project, extract throughput data from the last 120 days, and create a forecast for the next 5 weeks. I'm picking 120 days of data simply because I know I have that much data. It could be any value you'd like.
The output from the azdoutil forecasting tool:
How many items will we likely get done in 5 week(s)?

50% confidence threshold: 10 item(s)
80% confidence threshold: 8 item(s)

Throughput '5' --> 17 occurrence(s)
Throughput '6' --> 21 occurrence(s)
Throughput '7' --> 83 occurrence(s)
Throughput '8' --> 93 occurrence(s)
***
Throughput '9' --> 204 occurrence(s)
***
Throughput '10' --> 137 occurrence(s)
Throughput '11' --> 191 occurrence(s)
Throughput '12' --> 106 occurrence(s)
Throughput '13' --> 107 occurrence(s)
Throughput '14' --> 30 occurrence(s)
Throughput '15' --> 11 occurrence(s)
Looking at that data from the tool, the 50% confidence line is somewhere in the 10 item throughput group. The 80% confidence line is somewhere in the 8 item throughput group. A 9 item throughput was the most common outcome and happened 204 times.
Understanding & Communicating Your Level of Confidence
Why do you care about levels of confidence? For me, I love having that kind of data so that I can be speak intelligently what the likely outcomes are. When one of my customers asks me "how much can we get done in 5 weeks?" I can say something like "we're 80% confident that we can get 8 items done. There's a 50/50 chance that we get something like 10 items done. Worst case, we only get 5 items done but there's an extremely small chance of that being the actual outcome." You could also point out (using this data) that getting 10, 11, or 12 items done is much more likely than getting 5, 6, or 7 items done.
Summary
You probably already have all the data you need to start predicting the future forecasting the future using throughput. If you've been managing your work using Azure DevOps, that data is already there. Just use AzdoUtil's forecasting features to extract the data.
And remember that there are three types of forecast that you can get from AzdoUtil:
forecast duration for item count
forecast items in weeks
forecast work item
Once you've got that throughput data, your predictions are much more accurate and much easier to explain to people who aren't on your team. Plus, it's a lot less work for the team to gather that data -- they simply need to do what they do best -- deliver done software.
-- Interested in learning more about how to predict the future and manage your work using flow metrics? Need help adopting or streamlining your use of Azure DevOps? Want some help with Scrum or Kanban? We can help. Drop us a line at info@benday.com.