I’ve been helping a customer develop some Visual Studio 2010 Web Performance Tests and Load Tests for their application. Basically, they have an estimate in mind for how many simultaneous users they need to support and want to verify that they can actually handle this load.
Their application is a Silverlight front-end that talks to a number of WCF Services. The focus for the load tests have been been primarily the WCF services and the server-side code. For the first few days, we tried to look at how many service calls and see how many simultaneous operations they were handling and how quickly each operation completed. You can basically figure this out by watching response times on the [ServiceOperation] methods but, in our case, once we started finding some performance issues, this data was not detailed enough.
**The Problem:
**When load testing a running application, it’s not always possible to know exactly what’s going on in an application simply by profiling the public endpoints.
**The Solution:
**Rather than indirectly guess at what’s going on, you can create custom Performance Counters that will provide detail about what’s happening in the application. Once you’re instrumented the code with your custom performance counters, you can access the counter values at runtime using Performance Monitor (perfmon.exe) and/or.Visual Studio 2010 Load Tests.
**The Counters:
**In the application, we had approximately 20 different operations that we wanted to gather performance numbers for. For example, “Report Loading”, “Report Saving”, “Login”, etc. For each of these operations, we needed to know
- how many of these operations have occurred
- how many operations are occurring per second
- the average duration of the operations
- number of operation-related errors
**Goals:
**Since we’ll have roughly 20 different operations and each operation will have approximately 4 performance counters, we wanted to create an object structure that would
- minimize duplicate or nearly duplicate code
- provide a unified and consistent way to create and delete performance counters when the application is deployed
- be easy for a developer to implement without having to understand the innards of the performance counter implementation.
The Design:
(First off, big thanks to Michael Groeger’s article on The Code Project for the discussion of how to create the counters.)
To satisfy the design goals, we created a single class called OperationPerformanceCounterManager (figure 1). To record an operation, you access an instance of OperationPerformanceCounterManager and call RecordOperation(). If you have timing information to record, you’ll call RecordOperation(long duration) and pass the number of ticks that it took for your operation to execute. If you encounter an error or have another operation that does not have any timing information, you’ll call the version of RecordOperation() that doesn’t take any parameters.
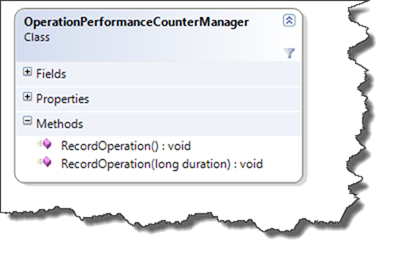
Figure 1 – Operation Performance Counter Manager handles all the performance counter implementation details for a single operation type
The implementation in your application code is very straightforward. You’ll create instances of OperationPerformanceCounterManager classes providing the Performance Counter Category and the Operation Name (see Figure 2).
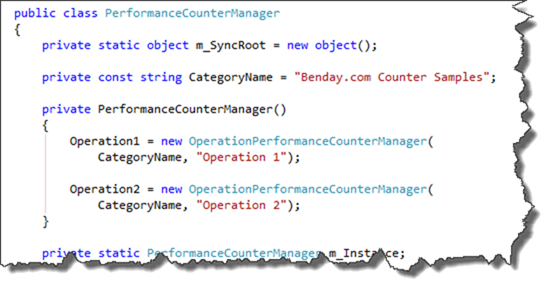
Figure 2 – Create instances of OperationPerformanceCounterManager by supplying the Category and Operation Name
Then your code only needs to gather the duration for the operation in ticks (NOT milliseconds) and then call RecordOperation() on the appropriate instance of OperationPerformanceCounterManager (see Figure 3).
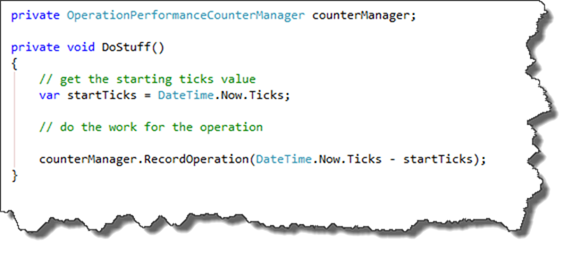
Figure 3 – Gather the duration in ticks and call RecordOperation
When the application is running, you can either connect to it using Performance Monitor (see Figure 4) or collect the counter data using Visual Studio Load Tests.
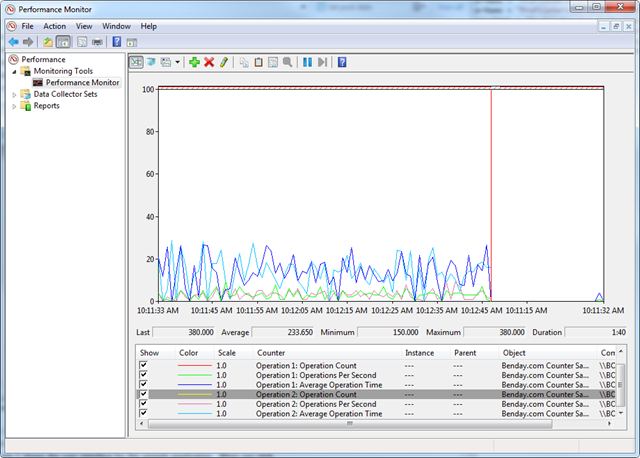
Figure 4 – Accessing performance counters from perfmon.exe
A Sample Application
In order to prove these out, I created a sample application that spins up a number of threads to do some work. While the work is being performed, the application is continually updating its custom performance counters. Figure 5 shows the user interface for the sample application. When you click Start, it starts the threads. In order to see the performance counters change at runtime, you can change the values for how the operations are executed. “Min Duration Time (ms)” is the minimum number of milliseconds that an operation will take. In order to simulate operations taking a varying amount of time, you can set “Duration Variation (ms)”. The the operation executes, the application will pick a random number between 0 and “Duration Variation (ms)” and add it to the operation time. “Min Wait Time (ms)” is the minimum amount of time that the application will wait before executing the next operation. “Wait Variation (ms)” is similar to “Duration Variation (ms)” except that it becomes the random amount of time between operations.
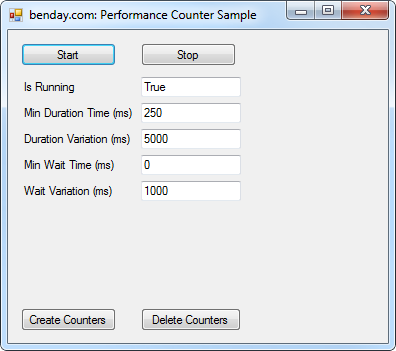
Figure 5 – The sample application’s user interface
Performance Counters are defined within Windows and the definitions have to be created before they can be accessed. The “Create Counters” and “Delete Counters” buttons call methods that create and delete the counter definitions on your workstation. This only has to be run one time on each workstation or server. NOTE: if you are going to create or delete the counter definitions, you must run the application as an Administrator.
Once you have created the counter definitions on your box and the application is running, you can start watching the Performance Counters. Open perfmon.exe, click the Add Counters button and then choose the counters from the list (see Figure 6).
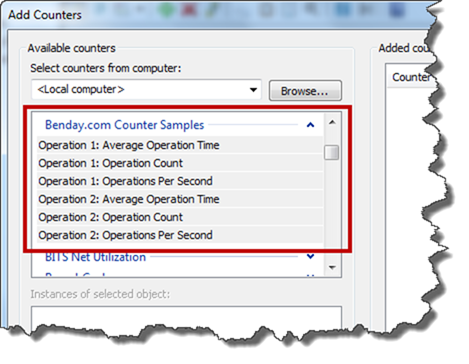
Figure 6 – Choose the custom performance counters via perfmon.exe
Here’s the link to download the source code.
-Ben
-- Have some sticky performance problems that you want help with? Trying to make sense of Visual Studio Web Performance Tests, Load Tests, and Load Test Rigs? Drop us a line at info@benday.com.


